CAMPAIGN REPORTING GUIDE
COMPREHENSIVE INSIGHTS FOR SMARTER CAMPAIGNS
Get the most out of your campaigns with our in-depth reporting tools. Our Campaign Reporting Guide walks you through detailed insights and visualizations, helping you track performance, engagement, and impact—all in one place.
CAMPAIGN REPORTING
Our campaign reporting allows retailers to see in-depth reports on campaign performance. These reports will offer a number of different charts that display information regarding the selected campaign.
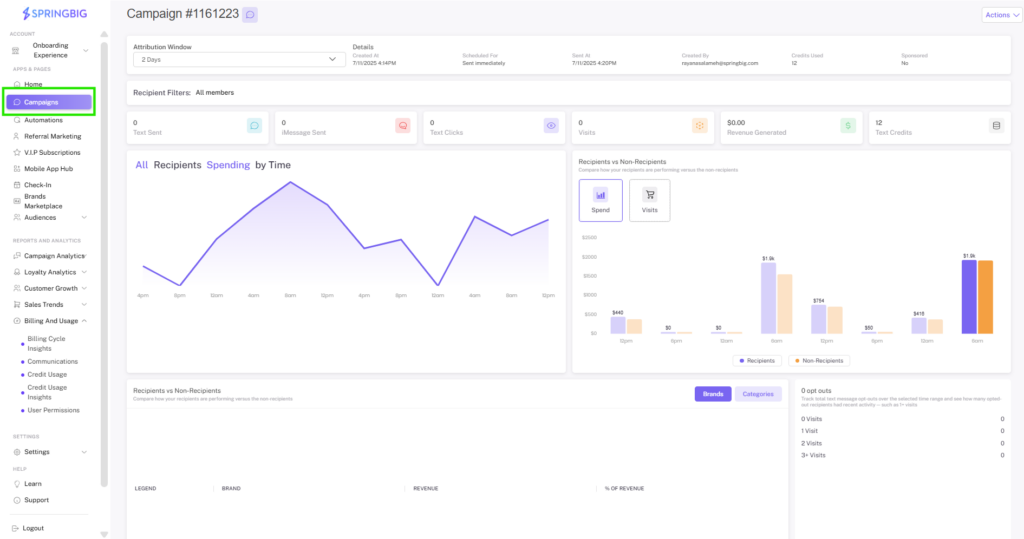
Step 1: Navigate to the campaigns page
Once there, select a campaign and you’ll see a page of all reporting options available for that campaign.
Step 2: Analyze
Once you click on the specific campaign, you’ll be taken to the following page where you’ll be able to view key KPIs, view and interact with charts, and even target customers based on the data.
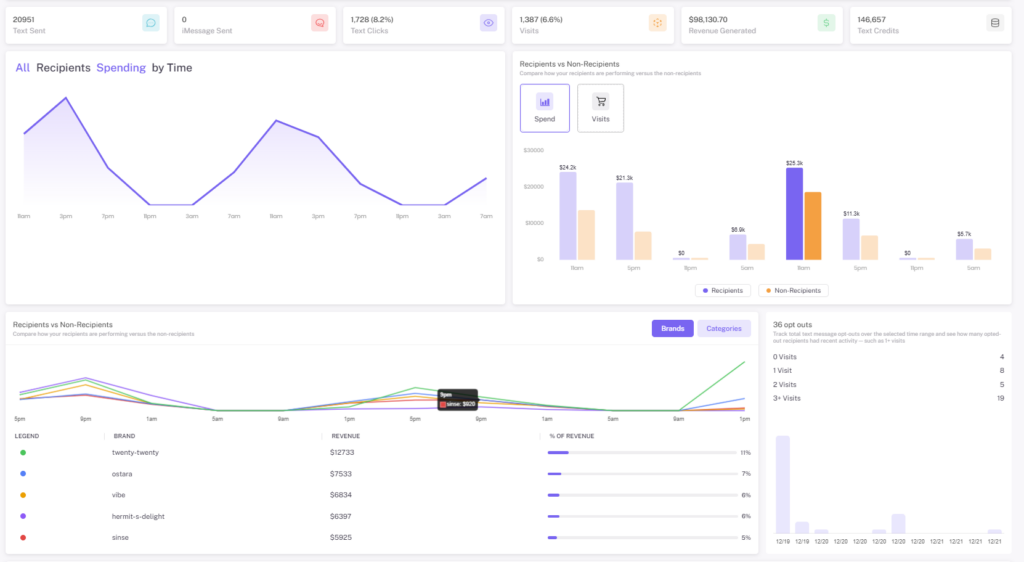
Step 3: Interact and target
On the campaign page, you can select a timeframe to analyze and interact with any of the blue text within the rows of KPIs or within the graphs. Clicking on these will allow you to either:
1. Select a timeframe to analyze.
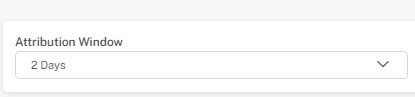
At the top left of your screen, select a timeframe to analyze between 6 hours and 1 month.
- 2. Create a follow up campaign based on the KPI
For example: Let’s say you want to target the members who shopped in store after receiving a campaign you sent with a special offer. To do this, click on the create follow up button in the top right corner. Once clicked, you can identify and curate a follow up message for the customers.

- For more information around email reporting, check out the Email Reporting Guide article.
- For more information around push notification reporting, check out the Push Notification Reporting Guide article.
VARIABLE TRACKING FOR CAMPAIGNS
With this feature, you’re able to select different time frames that will update your view of key performance data for your campaigns and autoconnects. This means you can more accurately compare the impact of your message over time, allowing you to make more informed marketing decisions.
Step 1: From the main menu, navigate to either campaigns or autoconnects to view a list of your messages and select the time frame you would like to track in the top left corner, under “Attribution Window.”
Springbig will automatically default to a 48 hour window.
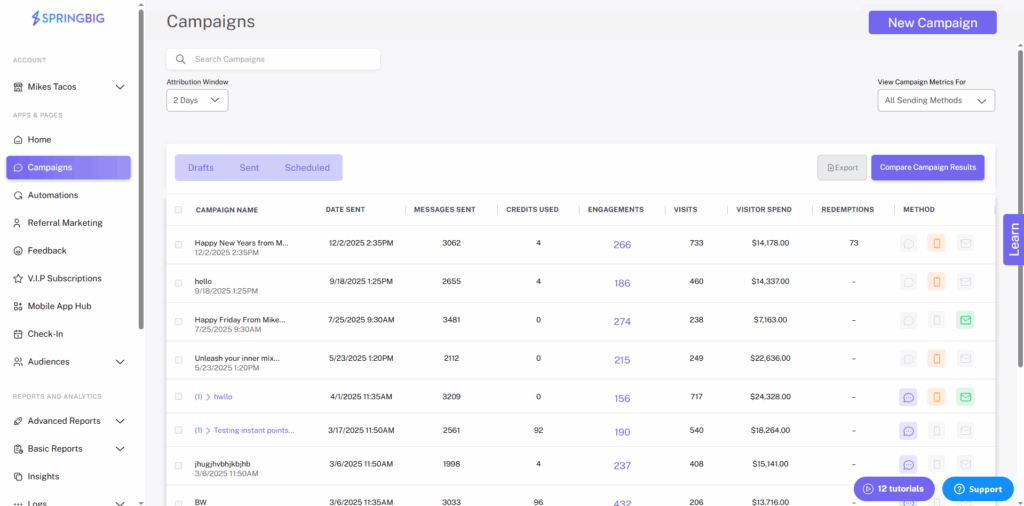
Step 2: Select the campaign or autoconnect you want to learn more about.
Step 3: Once you’ve selected a campaign or autoconnect to review, you will see the “Attribution Window” in the top left corner of the campaign/autoconnect overview page. Select the option you wish to view by clicking on the dropdown.
You can see how each campaign performs at:
- 6 hours
- 12 hours
- 1 day
- 2 days
- 5 days
- 1 week
- 2 weeks
- 1 month
Note: you also have the ability to export the data to share with your team by clicking “actions” –> “export campaign data”.
Keep in mind the campaign data will reflect the tracking duration selected on the campaign/autoconnect overview page.

MEDIA ENGAGEMENT REPORT
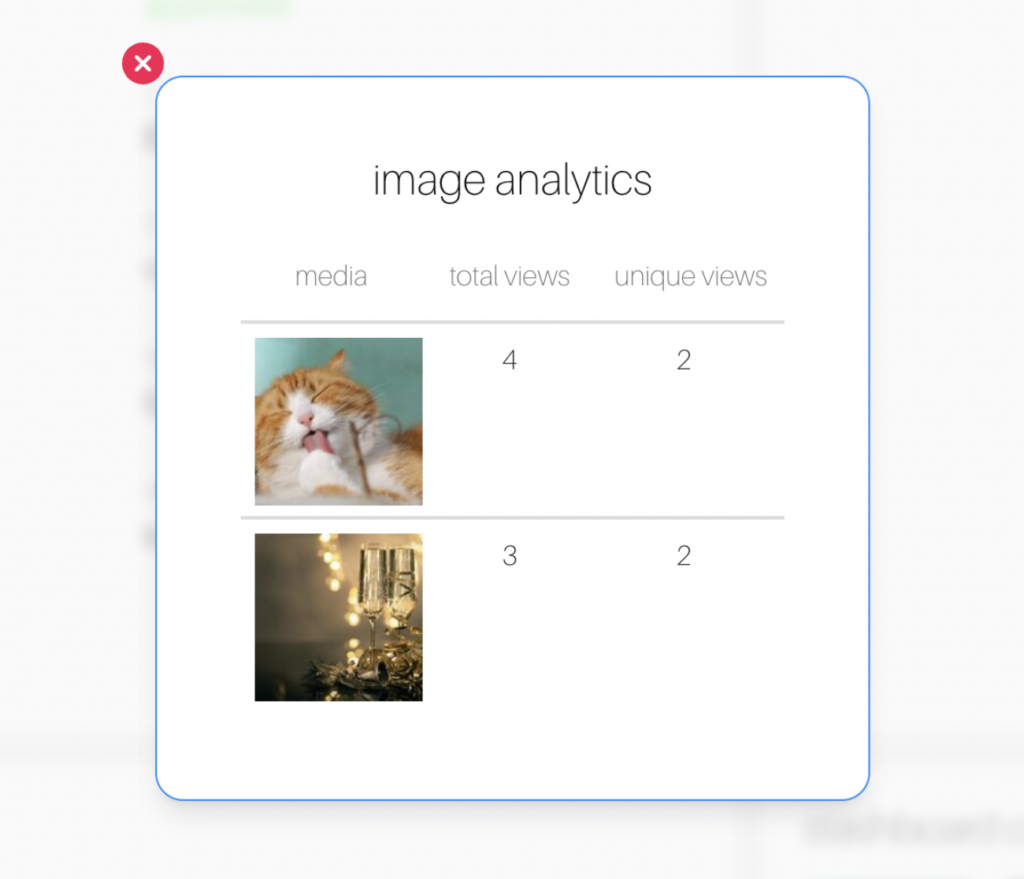
This report enables retailers to track the views of videos and images sent.
The report consists of 2 key columns: Total Views and Unique Views:
- Total Views: This column reflects the overall number of times each piece of media has been viewed.
- Unique Views: This column counts each user’s view only once. For instance, if a customer views the media 5 times, they will be counted only once in the unique views column.
Please note: If you are using the clickable images feature, the media engagement report will also track the number of clicks each image receives.
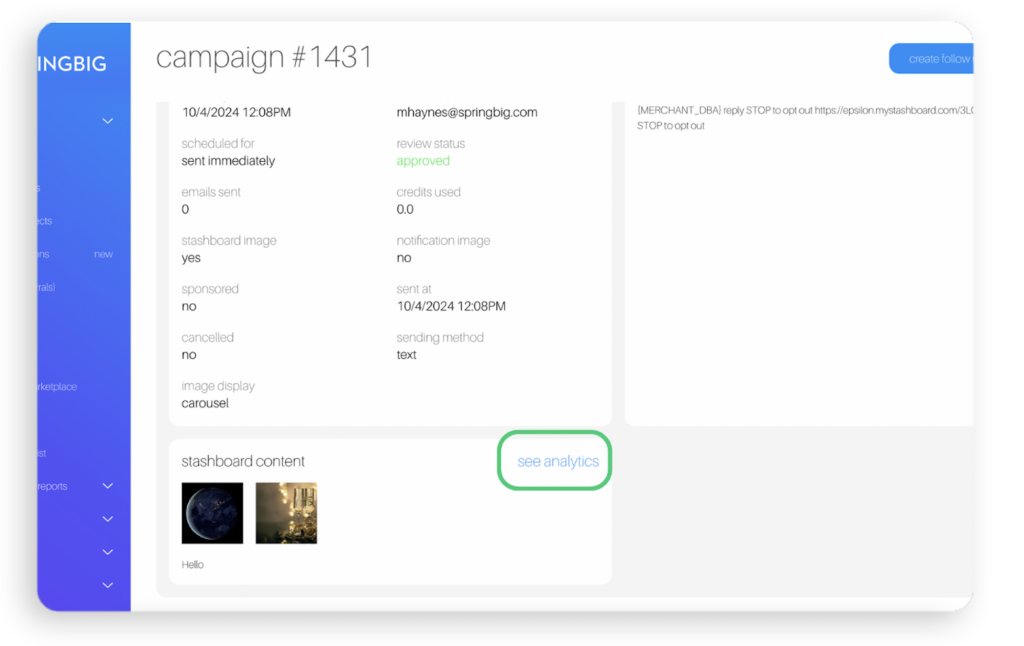
Step 1. Navigate to the Campaigns page within the Springbig UI.
Step 2. Select View on the campaign you would like to learn more about.
Step 3. Scroll down to the Message Content box.
Step 4. Select See Analytics.
EXTENSION ACTIONS REPORT
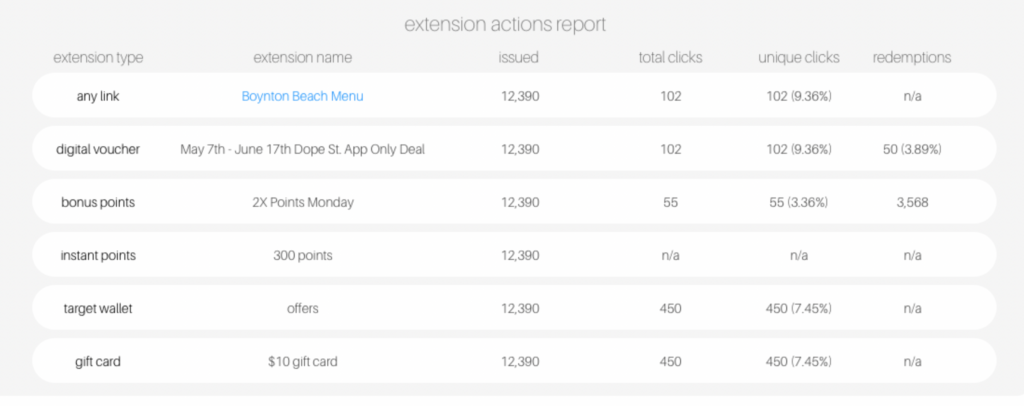
For Autoconnects and campaigns sent with extensions, an extension action report is now available. This report enables retailers to track every extension configured within an Autoconnect or campaign.
The report consists of 5 key columns. The columns consist of: the Extension Type, Extension Name, Issued, Total Clicks, and Unique Clicks.
- Extension Type: This column shows which extension type was selected.
- Extension Name: This column shows what the extension is named.
- Issued: This column shows the amount of extensions sent.
- Total Clicks: This column reflects the overall number of times each link was clicked.
- Unique Clicks: This column counts each user’s click only once.
- For instance, if a customer views the media 5 times, they will be counted only once in the unique clicks column.
- Redemptions: This column counts each redemption.
- Please Note: The redemption data will only appear for the digital voucher and bonus points extensions.
Step 1. Navigate to either the Autoconnects page or the campaigns page within the Springbig UI.
Step 2. Select View on the Autoconnect or campaign you would like to learn more about.
Step 3. Select the Extension Actions Report.
COMPARE CAMPAIGNS FEATURE
The compare campaigns feature allows you to select up to four of the campaigns that you’ve sent previously and compare them side by side, allowing for easy a/b testing and comparisons between campaigns and making it that much easier to create and fine-tune effective campaigns.
Step 1. Click the Compare button
On the campaigns page of the platform, you can click on the compare button at the top left of the campaigns list to get started.
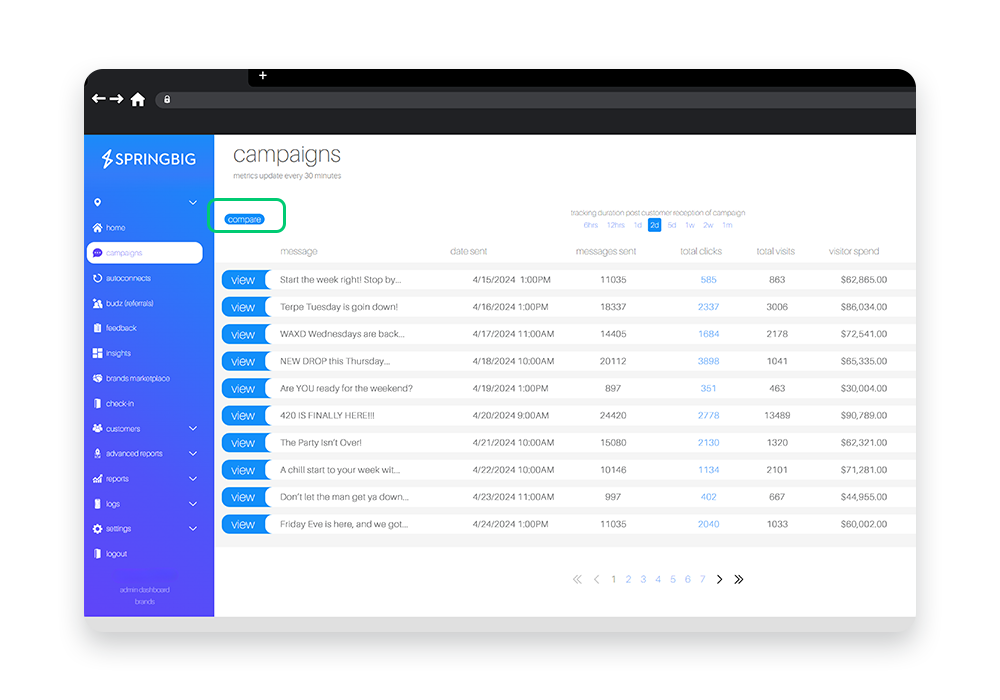
Step 2. Select the campaigns you wish to compare
Next, you will be able to select up to four campaigns to compare side-by-side by clicking the blue select tab to the left of the message in the list. In this case, we chose three. Once selected, click the blue view button.
Note: The view button will only be available when you’ve selected more than 1 campaign. This button will also display how many campaigns you’ve selected.
Tip: To get the most out of this feature, make sure the campaigns you’re comparing have distinctly different aspects so that you’re able to attribute the data to those specific aspects of the campaign. for example, choose campaigns sent at distinctly different times to see how time of day affects visits.
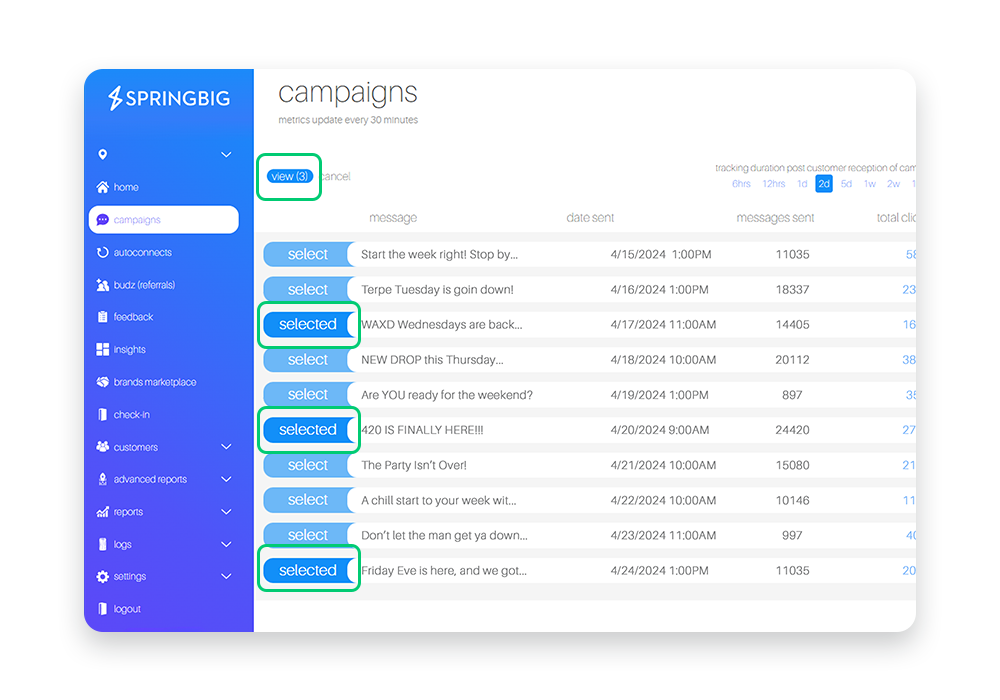
Step 3. View your data side-by-side
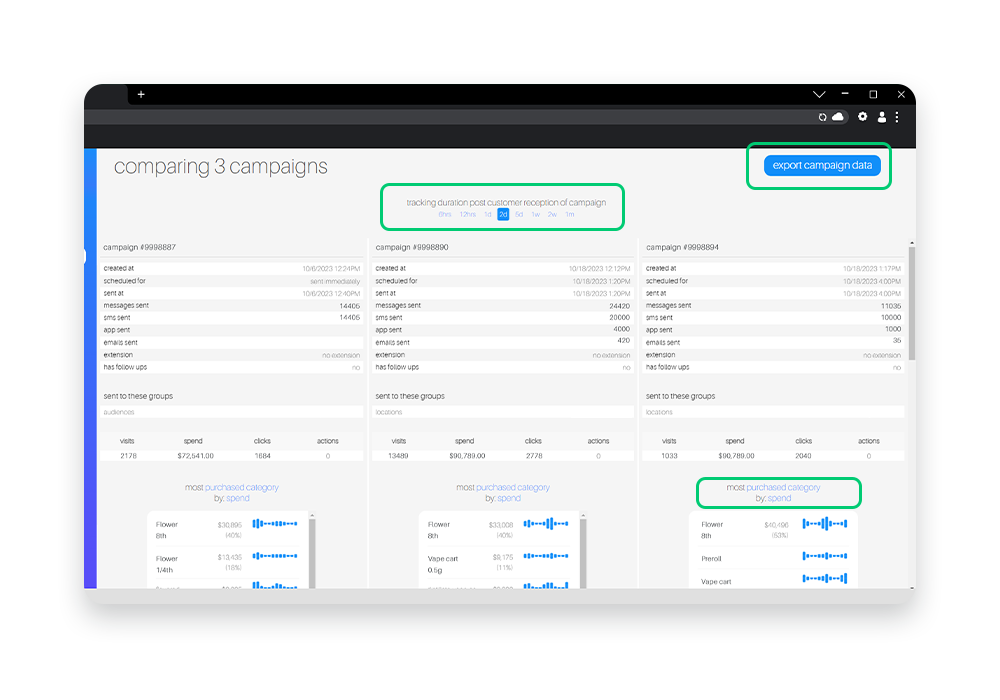
When view is clicked, you’ll be taken to the campaign comparison page where you’ll see the campaigns you selected side-by-side, allowing for easy comparison.
Note: The campaign comparison page is interactive and allows you to easily view and compare specific campaigns KPls.
Note: To export the data, click the export campaign data button in the top right corner of the page
- Notes:
- You will be able to adjust the time frame of the campaign comparison by simply selecting a time frame at the top of the page. you can choose anywhere from 6 hours after the campaigns were sent, to 1 month after.
- The charts within the campaign comparison page are interactive. Click the blue words above the charts in order to change the content of the charts and view different KPls