
SPRINGBIG'S REPORTING GUIDE
YOUR REPORTING, SIMPLIFIED
Table of Contents
REPORTING OVERVIEW
You have multiple, exciting ways to access and leverage data through Springbig:
- Access to a broad list of standard reports and list exports included with your subscription available either through the UI or directly from our reporting team
- Subscribe to our insights dashboards to take a deeper dive into understanding your member list, loyalty program, campaign performance and retail sales and applying learnings to accelerate growth and increase your returns
- Compare your performance against your in-state competitors with benchmarking data from our insights+ offering
- Build your own data queries out of Springbig’s Snowflake instance using DataHub
- Request custom analytics, list exports and dashboards to be built by Springbig’s Analytics and Reporting team on an a la carte basis
Use the logs and reports tabs on Springbig’s platform to track your customers actions and engagement.
Logs show what visits, redemptions, and messages have been tracked through Springbig.
Reports allow you to see real data within the platform to help you track customer, user, and campaign results.
LOGS
This section will cover springbig logs. Logs show customer engagement / messages with the following sections: visits, rewards, offers, and sms. View a list of all visits, redemptions, and outbound SMS on the respective page.
In this section, you will learn:
- What logs are available in the Springbig platform
- What KPIs show up in the logs
- Pro tips for navigating logs
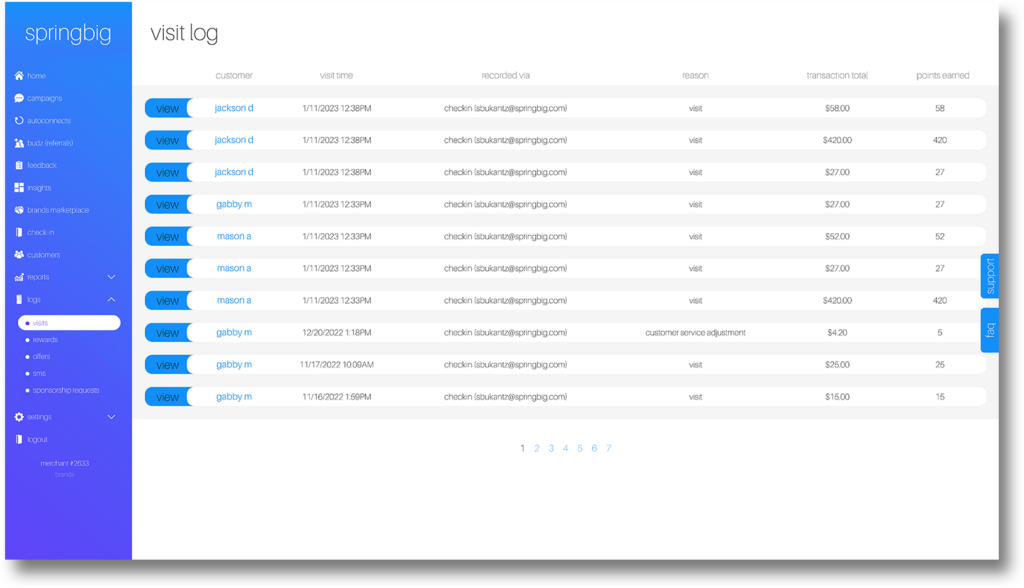
Visit Log
Check the Visit Log to track visits and check-ins directly from the springbig platform. KPIs shown: customer (click to view customer profile), visit time, recorded via (this will show how the visit was recorded – POS, checkin, or tablet), visit reason, transaction total, and points earned.
Tip: Easily navigate through pages by updating the page number in the URL to look at past visits or check your POS visit reports for more info or when comparing information.
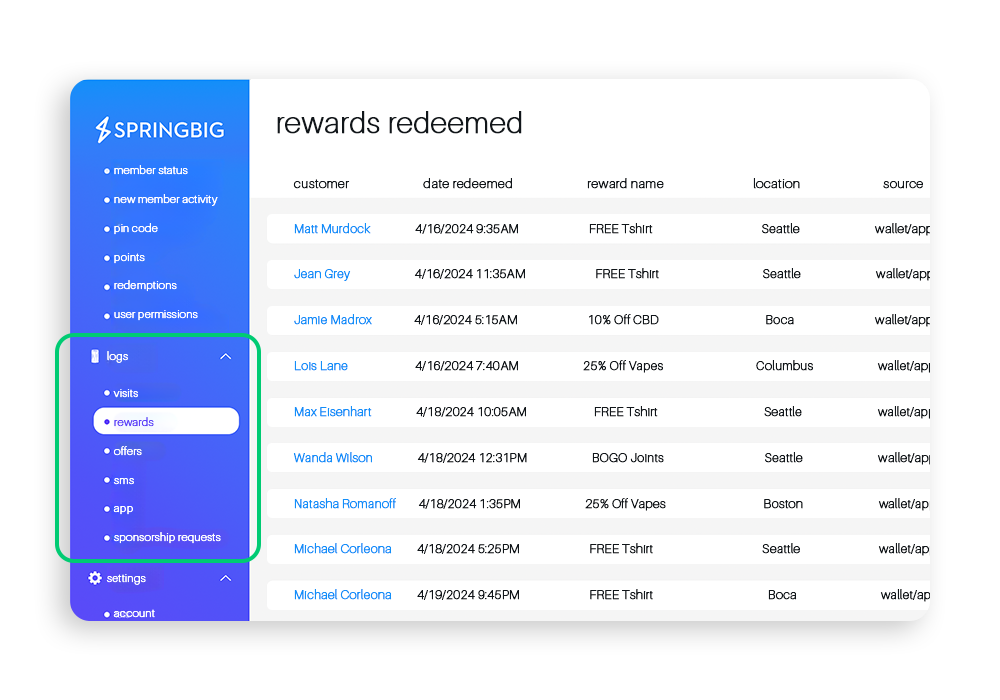
Rewards Log
Check the Rewards Log to view all reward redemptions. KPIs shown: customer (click to view customer profile), date redeemed, reward name, location, source, reward value, and confirmation code (for reporting reasons).
Tip: For point of sales without redemption capabilities, compare your reward log with your POS discounts to audit redemptions with discounts to ensure that discounts are being redeemed properly in both places.
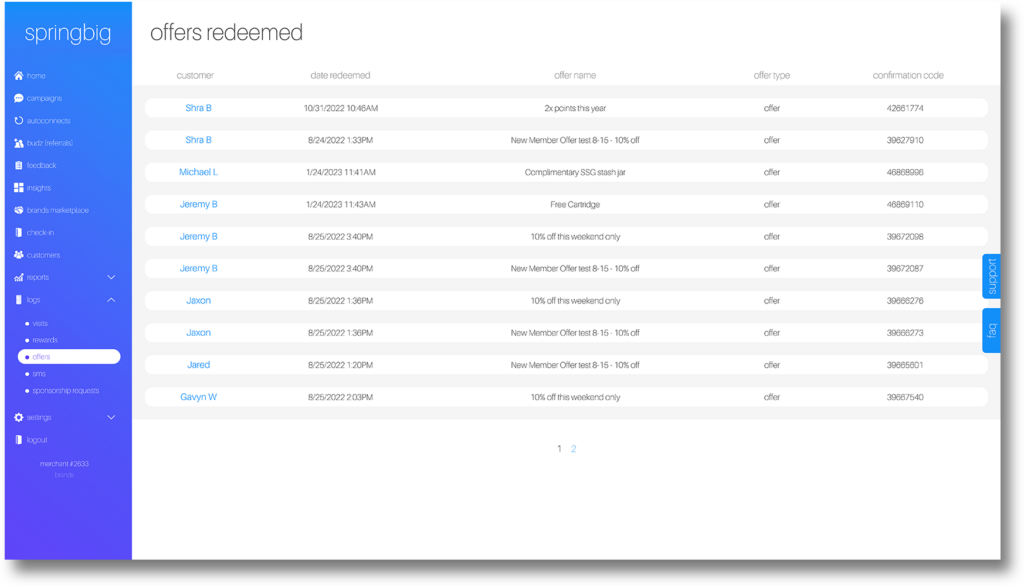
Offers Log
The Offers Log shows offer redemptions. KPIs shown: customer (click to view customer profile), date redeemed, offer name, offer type, and confirmation code (for reporting reasons).
SMS Log
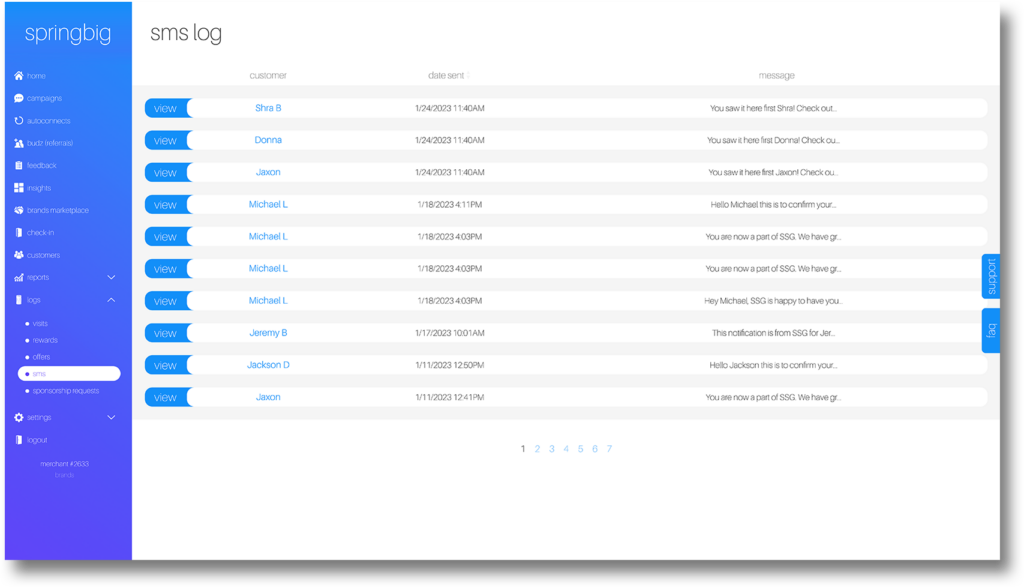
The SMS Log shows all outbound sms from the Springbig platform. KPIs shown: customer (click to view customer), date sent, and message. Click to view more info including full message.
APP LOG
The App Log shows all outbound push notifications from the Springbig platform. KPIs shown: customer (click to view customer), date sent, and message. Click to view more info including full message.

Sponsorship Requests Log
The Sponsorship Request Log shows all brand sponsorship requests submitted within the Springbig platform. KPIs shown: brand name, request sent, and request type.

REPORTS
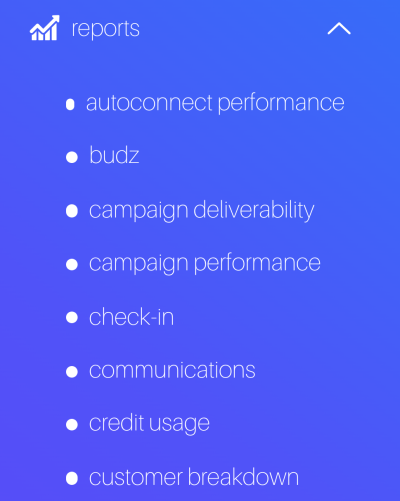
Springbig offers many reports to help track customer actions and engagements, the impact of campaigns and autoconnects, user actions and access, and more.
View the various reports available in this section.
Tip: Download your reports to view them in an excel file and in most cases, access additional data.
Autoconnect Performance Report
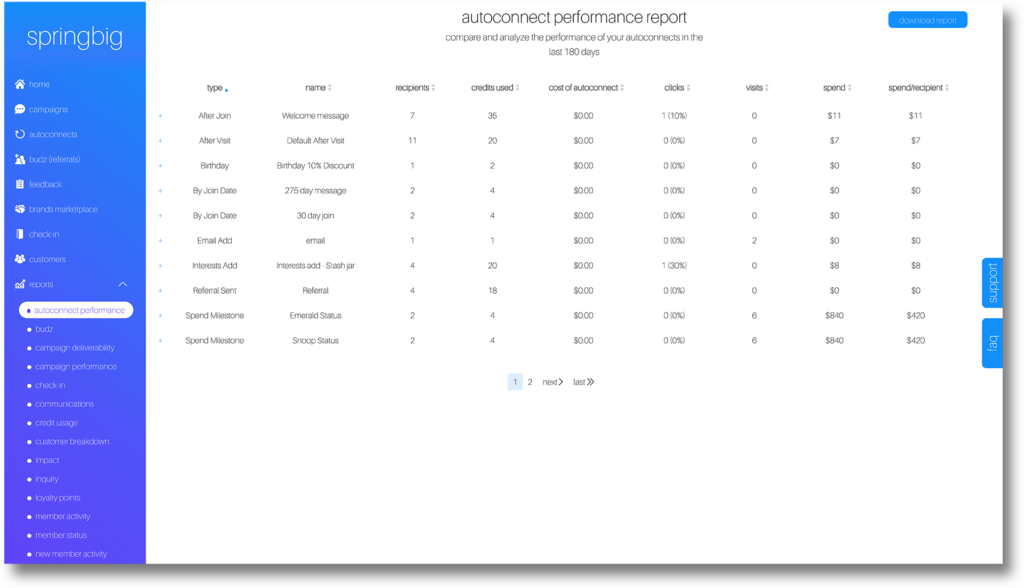
The Autoconnect Performance Report can be used to compare and analyze the performance of your autoconnects in the last 90 days. View or download the report.
View the following KPIs: type of autoconnect, name of the autoconnect, recipients of the autoconnect, credits used, cost of autoconnect, clicks, visits*, spend*, and spent per recipient.
*Visits and spend are tracked for 48 hours after the autoconnect is sent.
View the guide below this image for more info!
The following KPIs are available on the downloadable report:
| Autoconnect ID | Type of Autoconnect | Name | Recepients | Credits Used | Cost of Autoconnect | Clicks | Click Thru Rate | Visits | Spend | Spend/Recipient |
Budz Report
The Budz Report allows you to compare and analyze the performance of your campaigns. Adjust the timeframe to look at different times within the last 90 days. View or download report.
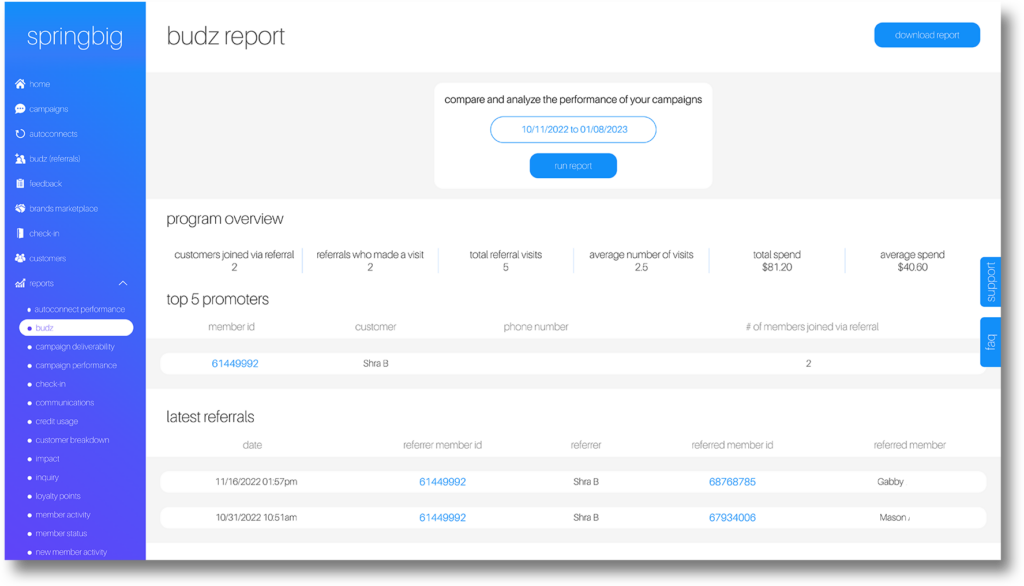
The following KPIs are available on the downloadable report:
| Date Range | Number of Joins | Referrals who made a Visit | Number of Visits | Average Number of Visits per new member | Total Spend | Average Spend |
The Campaign Performance Report allows you to compare and analyze the performance of your campaigns. Adjust the timeframe to look at different times within the last 90 days. View or download report.
Campaign Performance Report
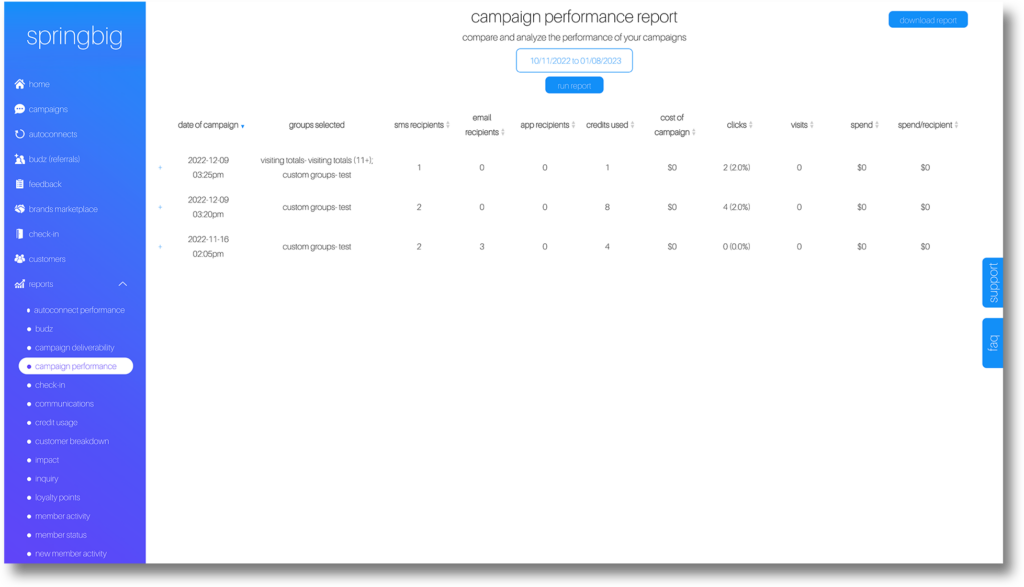
The following KPIs are available on the downloadable report:
| Campaign ID | Date of Campaign | Groups | Segments Selected | SMS Recipients | Email Recipients | App Recipients |
| Credits Used | Cost of Campaigns | Clicks | Clicks Percentage | Number of Visits | Spend | Spend/Recipient |
Check-In Report
The Check-In Report will allow you to analyze your check-in history with the following KPIs: customer, visit time, recorded via (tablet, or platform check-in), check-in reason, transaction total, and points earned. Select a date range within the last 90 days. View or download the report.
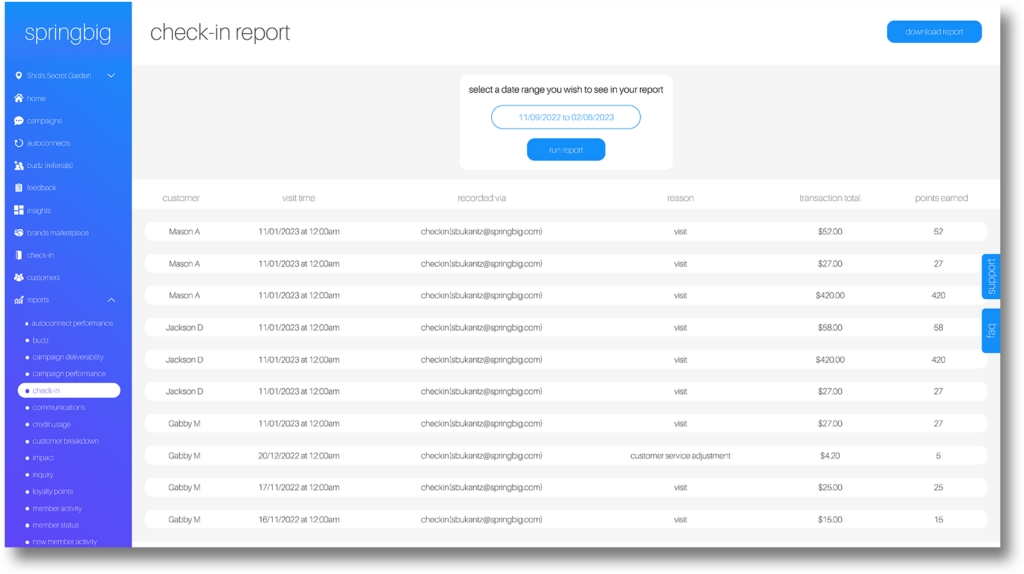
The following KPIs are available on the downloadable report:
| Retail Staff Member | Count of Check-in | Transaction Total | Points Issued |
Communications Report
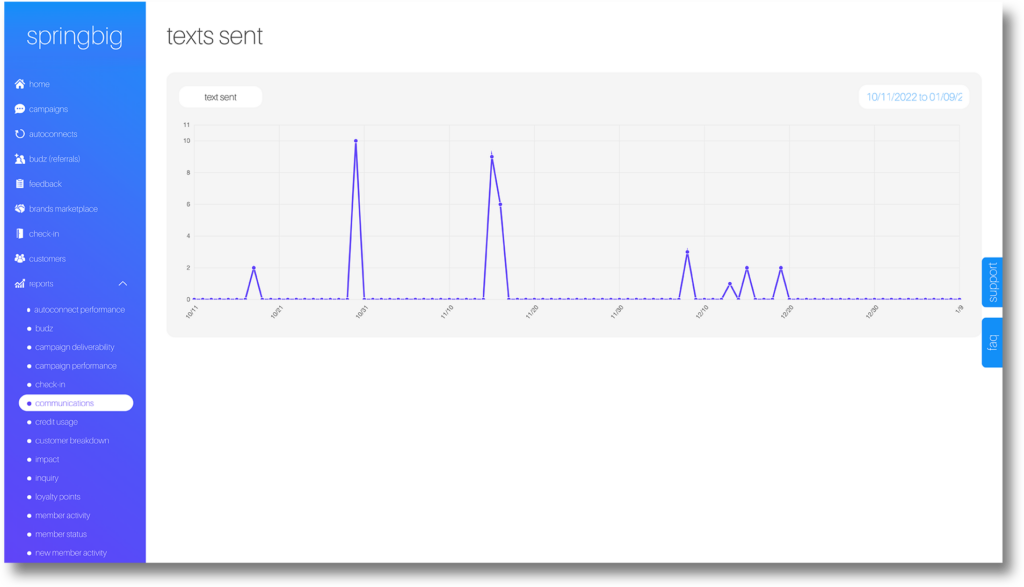
The Communications Report allows you to view texts sent over a designated time period. Adjust the time period to view more.
Credit Usage Report
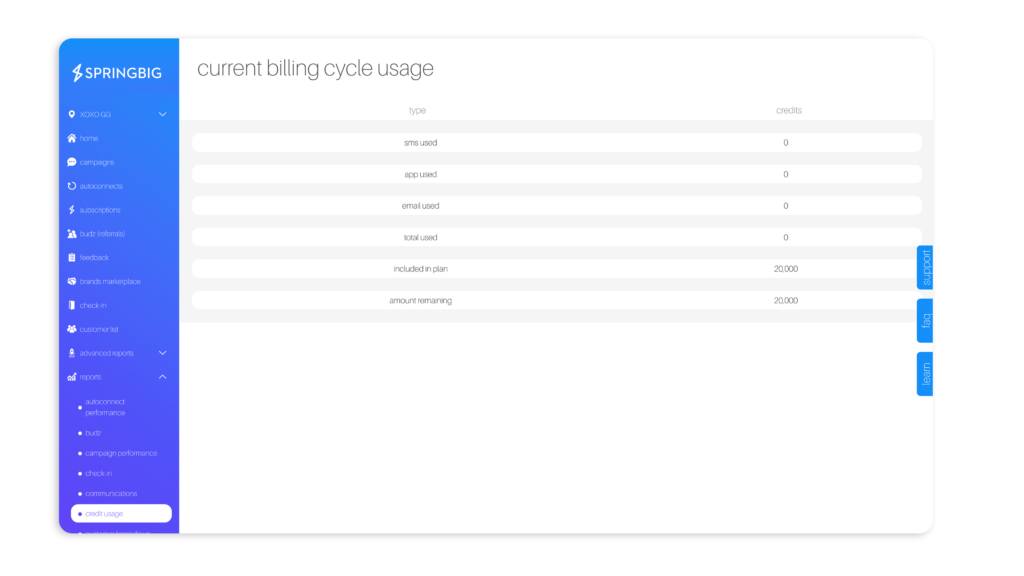
The Credit Usage Report can be used to review your credit usage in the current billing cycle. This report stays up to date with any used credits during the billing cycle, so be sure to reference this report if you have any questions around your remaining credit balance.
Customer Breakdown Report
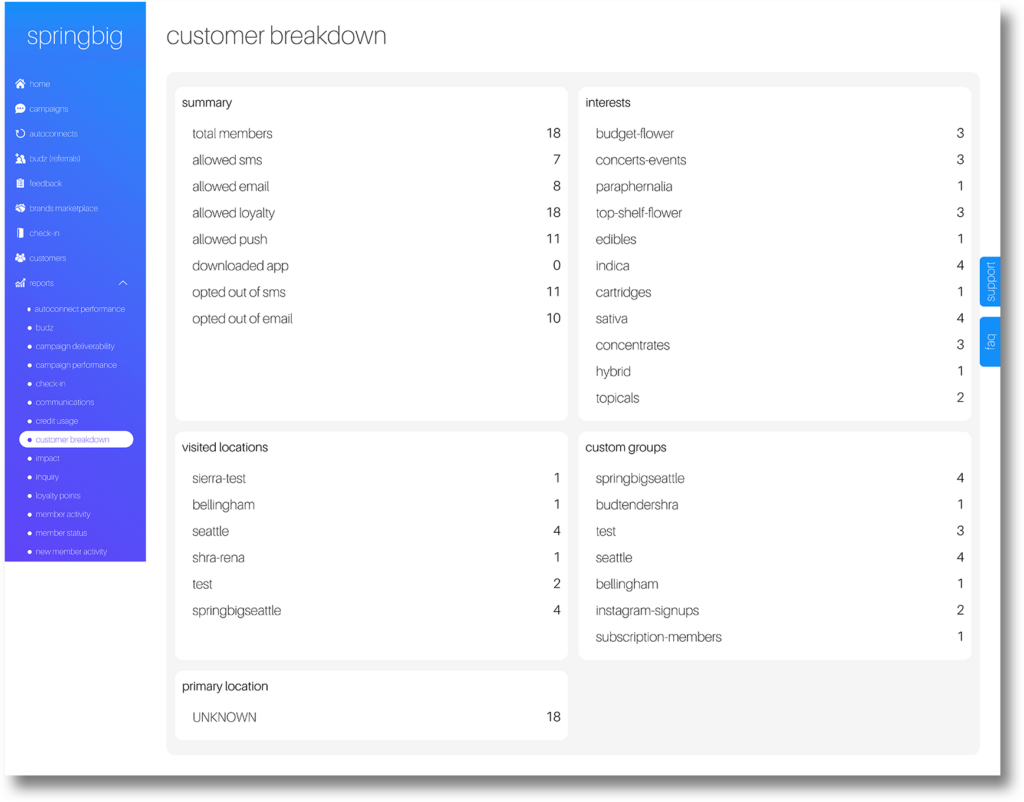
The Customer Breakdown Report shows a summary of your customer database including total members, allowed sms, allowed email, allowed loyalty, allowed push, downloaded app, opted out of sms, opted out of email. There is also a breakdown of how many members fall into interest groups, physical locations, and custom groups.
Loyalty Points Report
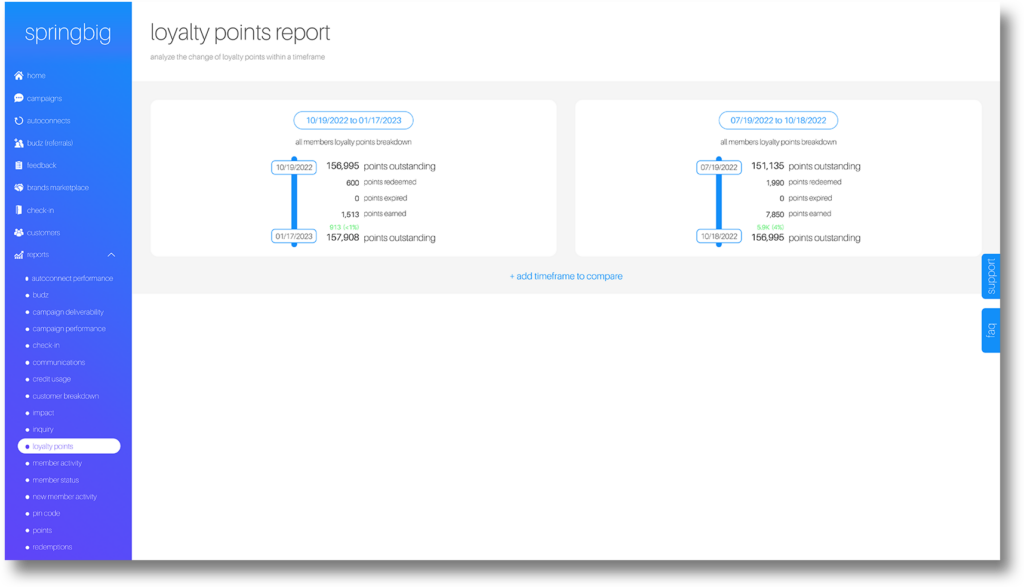
The Loyalty Points Report Allows you analyze the change of loyalty points within a timeframe. Click ‘+ add timeframe to compare’ to look at different timeframes side by side.
Member Activity Report
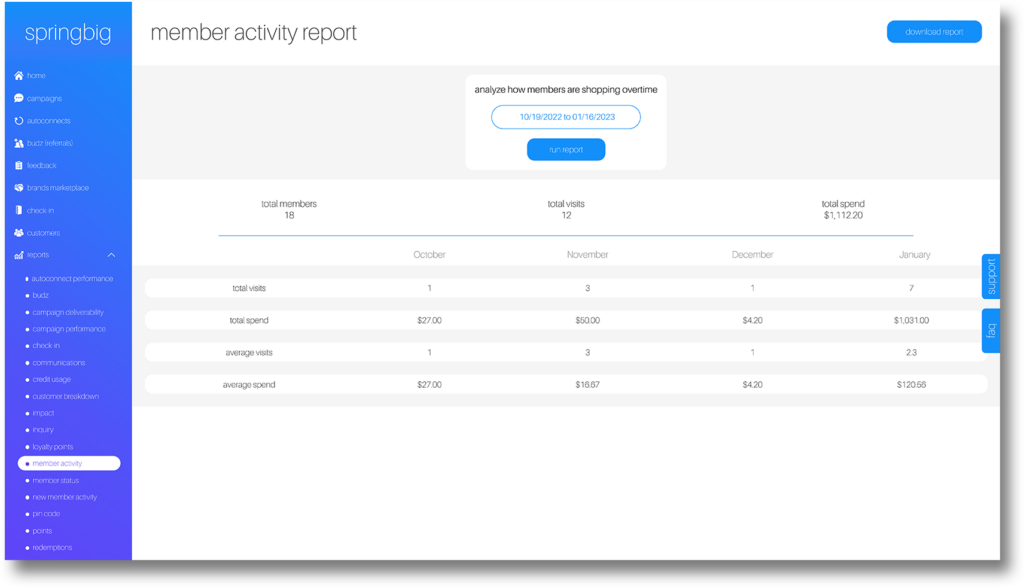
The Member Activity Report allows you to analyze how members are shopping overtime.
The following KPIs are available on the downloadable report:
| Date Range | Total Members | Total Visits | Total Spend |
Member Status Report
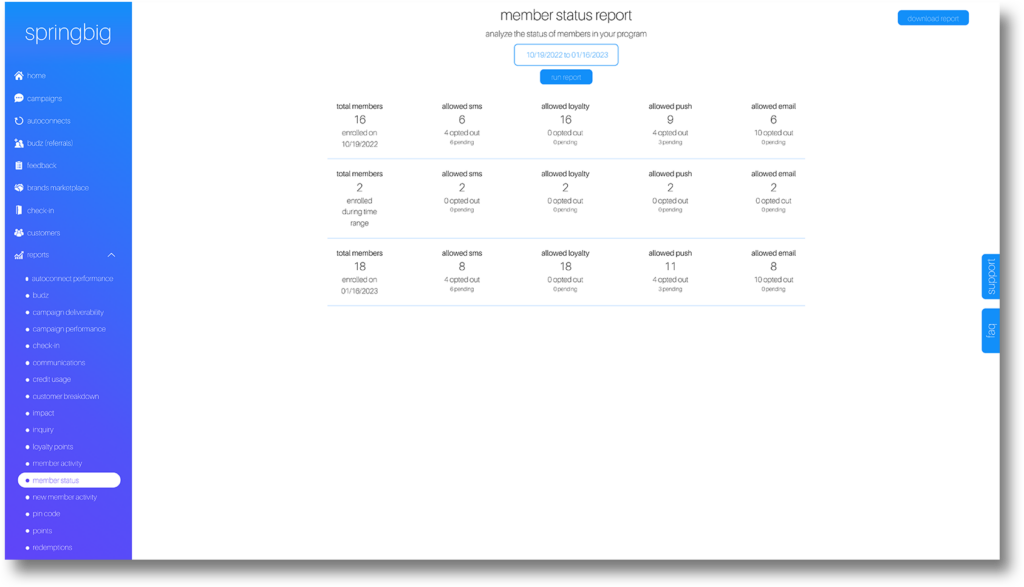
The Member Status Report allows you to analyze the status of members in your program. Adjust the timeframe to look at different times within the last 90 days. View or download report.
The following KPIs are available on the downloadable report:
| Total Members enrolled [beginning of date range] | Status | allowed sms | allowed loyalty | allowed push | allowed email |
| Total Members enrolled [during date range] | Status | allowed sms | allowed loyalty | allowed push | allowed email |
| Total Members enrolled [end of date range] | Status | allowed sms | allowed loyalty | allowed push | allowed email |
New Member Activity Report
The New Member Activity Report allows you to analyze how newly added members are shopping in their first 3 months. View or download report.
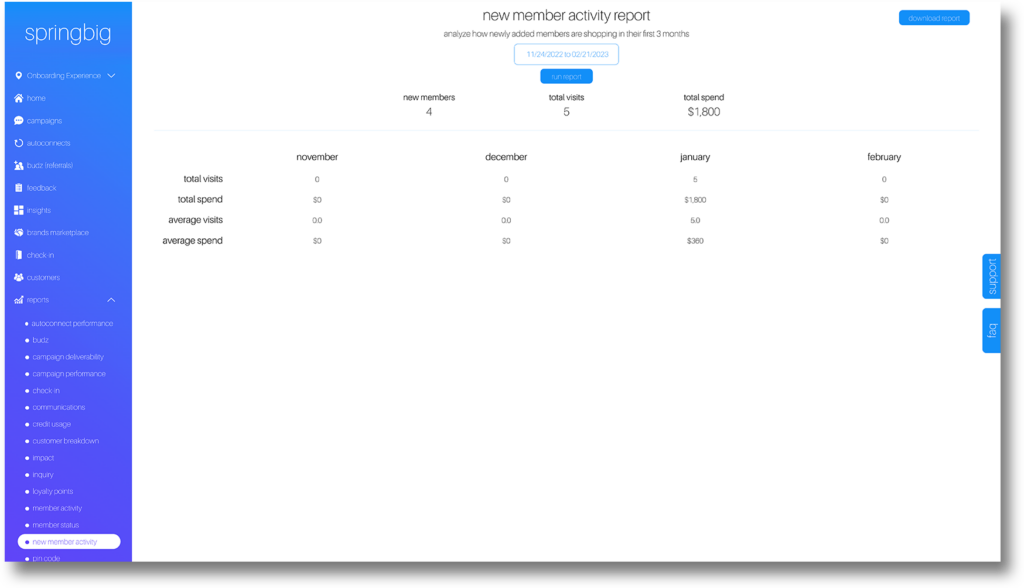
The following KPIs are available on the downloadable report:
| Date Range | New Members | Total Visits | Total Spend |
Pin Code Report
The Member Pin Code Report is used to analyze and download the number of members who have set up a pin code. This report can be downloaded from the platform.
The following KPIs are available on the downloadable report:
| members who are opted in | members with pin | % of members with pin | total members |
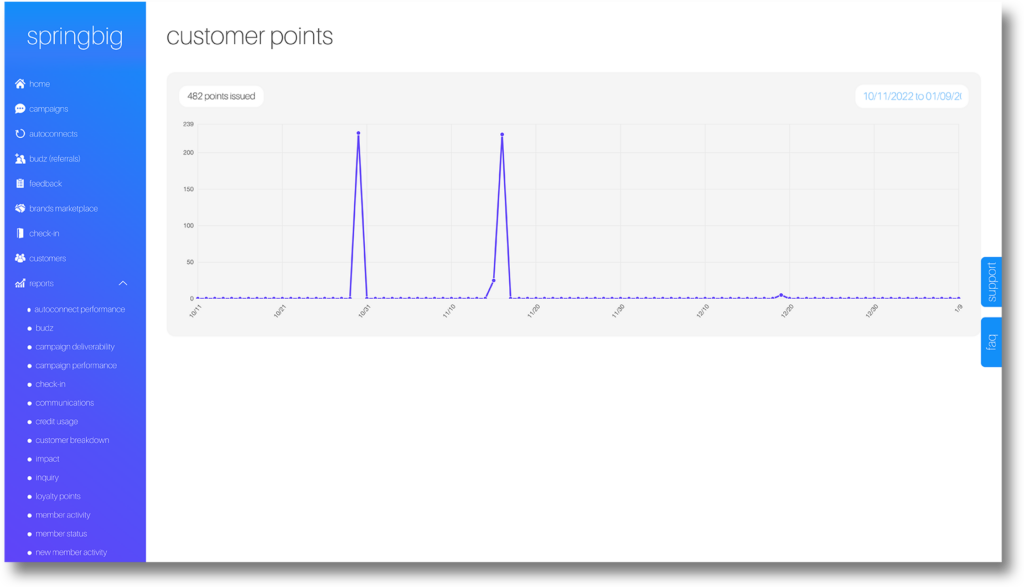
Points Report
The Points Report allows you to view customer points earned in a graph view over the last 90 days.
Redemption Report
The Redemption Report allows you to analyze how members are redeeming rewards. Adjust the timeframe to look at different times within the last 90 days. View or download report. Within the redemption report, retailers can easily view and analyze customer reward redemptions by location and by source. These reward redemption KPIs will be available and visible in the redemptions report, the rewards log, and within the customer activity page.

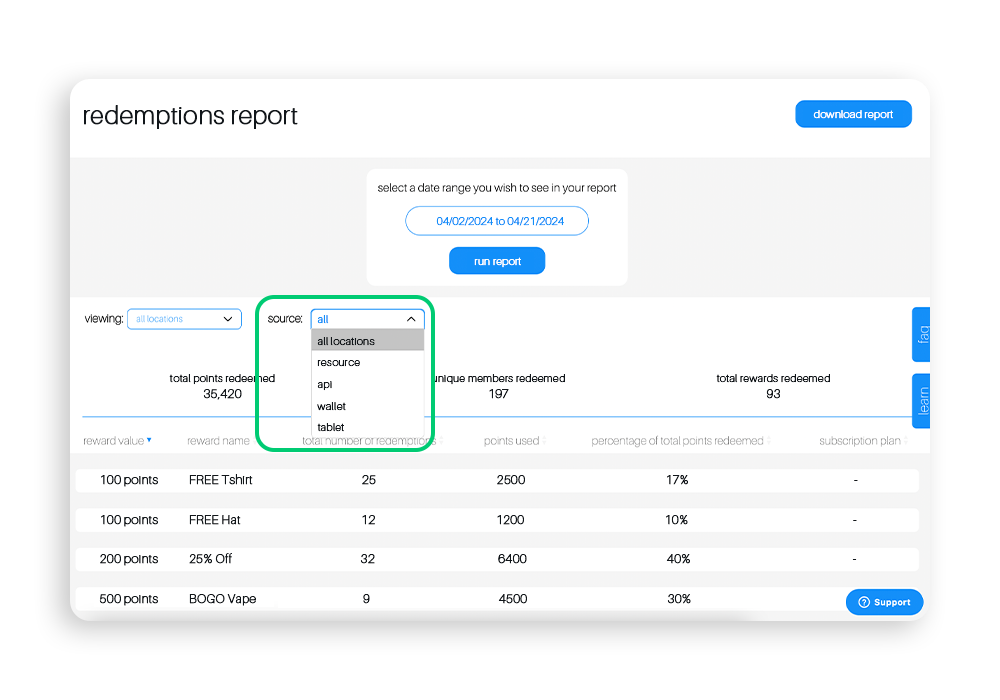
The following KPIs are available on the downloadable report overview page:
| Date Range | Total Points Redeemed | Unique Members | Rewards Redeemed |
The following KPIs are available on the downloadable report overview by location page:
| Date Range | Location | Total Points Redeemed | Unique Members | Total Rewards Redeemed |
The following KPIs are available on the downloadable report overview by source page:
| Date Range | Source | Total Points Redeemed | Unique Members | Total Rewards Redeemed |
The following KPIs are available on the downloadable report redemption report page:
| Location | Source | Rewards | Number of Redemptions | Points Used | % of Total Points Redeeme |
The following KPIs are available on the downloadable report details page:
| Member ID | Date Redeemed | First Name | Last Name | Reward Name | Reward Value | Subscription Plan | Location | Source |
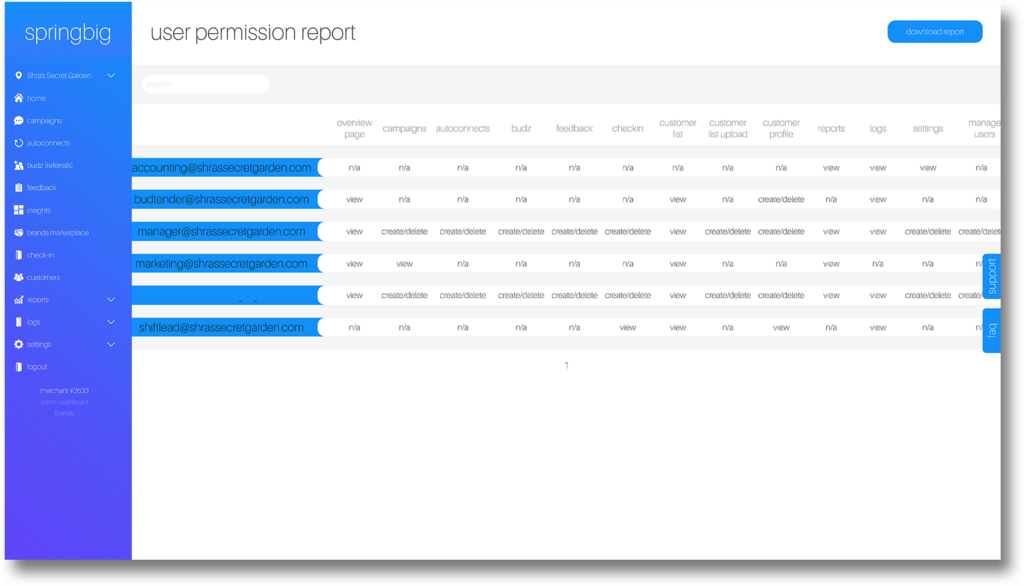
User Permission Report
The User Permission report allows you analyze the permission level of your users. You can make edits to User Permissions in Settings – Account – Manage Users.
Click on this report to view or download all User Permission and add new users / edit access in settings – account – manage users.
ADVANCED REPORTS
The Advanced Reports tab features our Impact and Inquiry reports. These reports feature more in depth data on the impact of actions from your customers, rewards, offers, and more. The Inquiry report also features a popular inquiries pop up that allows you to view the impact of popular inquiries.
Impact Report
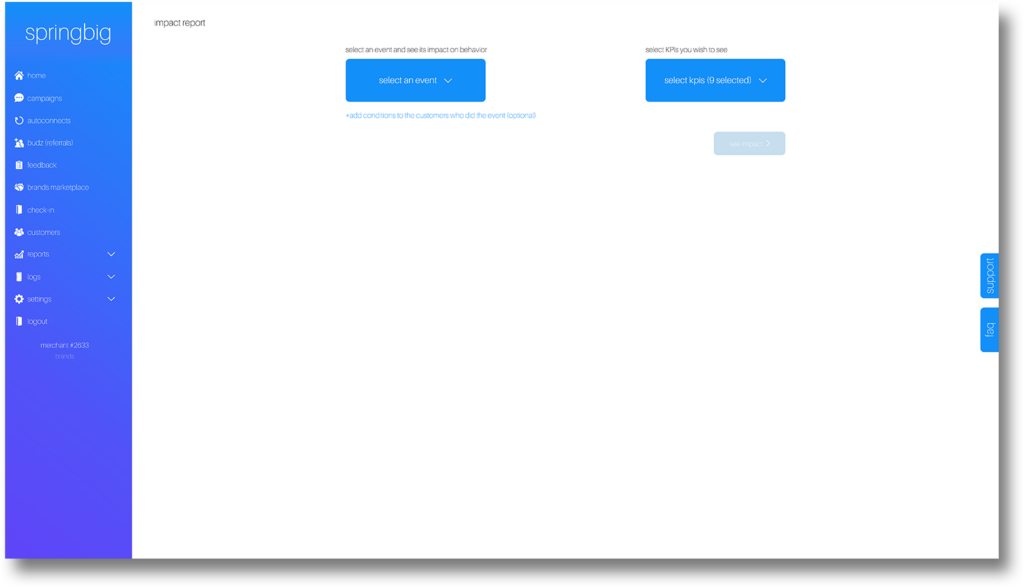
The Impact Report allows to select an event and KPIs to analyze the impact. Save and download reports for reference and create new reports to look at different events.
To set up:
- Click new report
- Select an event to see it’s impact on behavior. Events include:
- brand purchased
- category purchased
- purchase on day of week
- purchase within transaction range
- purchase within hours of the day
- purchase within calendar date range
- reward redeemed
- offer redeemed
- redemption count achieved
- visit count achieved
- spend total achieved
- Optionally, add conditions to the customers who did the event (based on recipient segments)
- Select KPIs (KPIs may vary based on POS integration
- members
- average ticket
- total spend
- average days as member
- total visits
- average number of redemptions
- visits with event
- spend with event
- points expired
- online transactions
- referrals
- visits with redemption
- spend on visits with redemption
- opt outs
- points redeemed
Inquiry Report
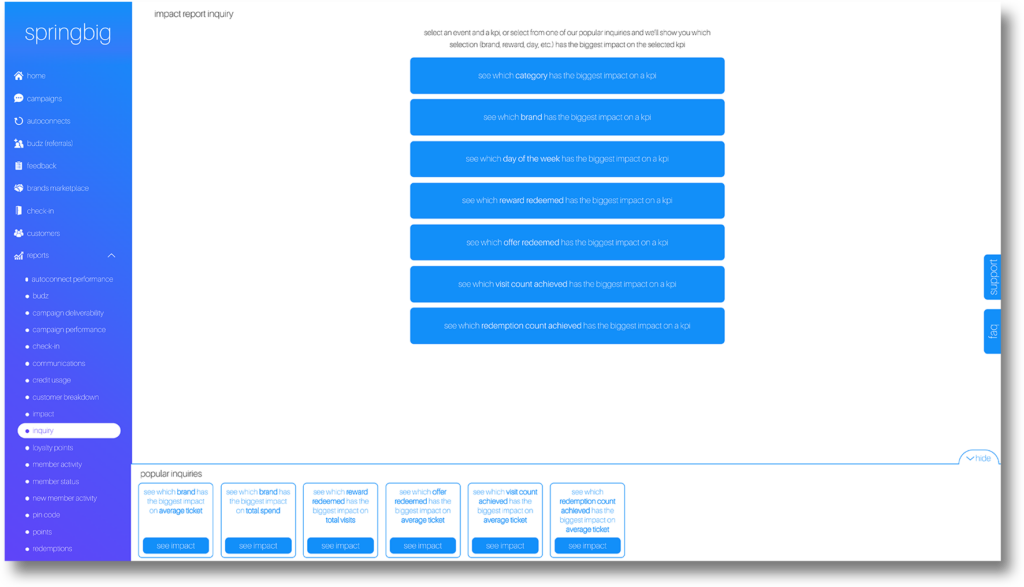
The Inquiry Report builds on the impact report and allows you to select an event and a KPI, or select from one of our popular inquiries and we’ll show you which selection (brand, reward, day, etc.) has the biggest impact on the selected KPI.
This report features the Popular Inquires tab which allows you to see the most popular inquiry reports being run and run them yourself to generate quick insights.
Popular Inquiries Preset
Popular Inquiries is a powerful tool that allows you to view the impact of specific events on your customers whether that be the impact of campaigns, discount you’ve sent, or even the items that customers have purchased. Now with the popular inquiries tab, you can now easily see the most popular inquiry reports being run and run them yourself to generate quick insights.
View this tab on the Inquiry Report page.
FREE QUICK REPORTS
In addition to the native reports in the Springbig platform, there are a handful of free quick reports that can be requested as well.
To request one of these or any custom report, Merchants can reach out to their dedicated account manager, email professionalservices@springbig.zendesk.com, or submit the Professional Services Request form within the support button on their Springbig platform!
Check out the available quick reports below!
Email Opt in/out Report
This report returns the member list of members who opted in or out of emails.
Columns: member id, first name, last name, email, primary location, opt_date, join date, current status
SMS opt in/out Report
This report returns the member list of members who opted in or out of sms.
Columns: member id, first name, last name, email, primary location, opt_date, join date, current status
SMS Credits and Messages Report
This report returns total messages and total credits by process type and SMS type (SMS or MMS), for a given date range.
Columns: process type, SMS type, credits, messages
Member Export
This report provides information at the member level for each member in the account.
Columns: merchant id, member id, first name, last name, address, city, state, zip code, med/rec, opt_out_date, total spend, subscriber number, email, allowed loyalty, allowed sms, allowed email, allow push notifications, pin code status, join date, last visit date, total number of visits, primary location, pos user, redeemed, point balance, last signature created, active subscriptions
App Downloads Report
This report provides app download counts.
Columns: merchant id, number of app downloads
Custom Groups and Audiences Report
This report provides either an Audience Report or a Custom Group Report.
Columns: Custom Group/Audience, member id, first name, last name, allowed sms, allowed email, allow push notifications
Redemption Report
This report runs a list of redemptions and point values for a specified date range.
Columns: redemptions
Top X Spenders Report
This report provides information around the top spenders in the account. Can be pulled for top 5, top 10, top 25, etc.
Columns: merchant id, member id, first name, last name, subscriber number, visits, spend, pos included